This data is from bench tests characterizing the valves and the dynamics of the system.
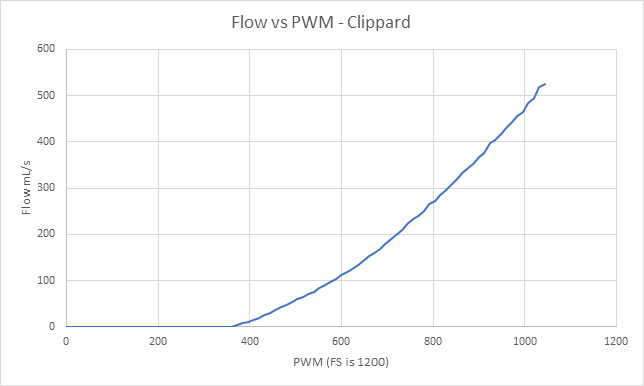
Figure B1: Flow vs PWM. Two Clippard EV-P-10-25A0-V valves and Siargo flow sensor.
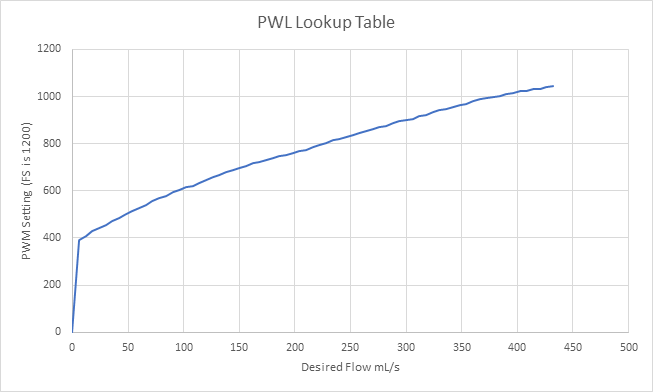
Figure B2: PWL table built to calibrate the dual Clippard valves.
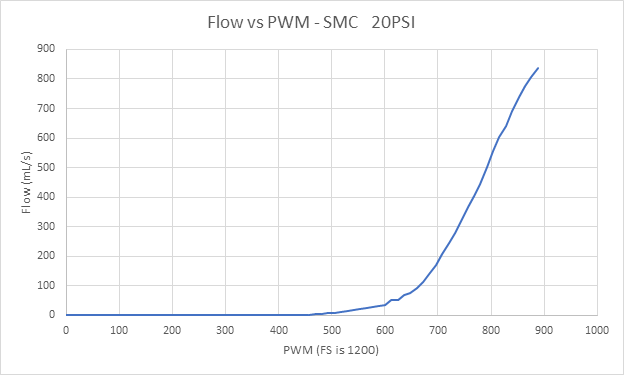
Figure B3: Flow vs PWM for SMC PVQ31-6G-40 valve. Full scale on flow meter is reached far below PWM full swing.
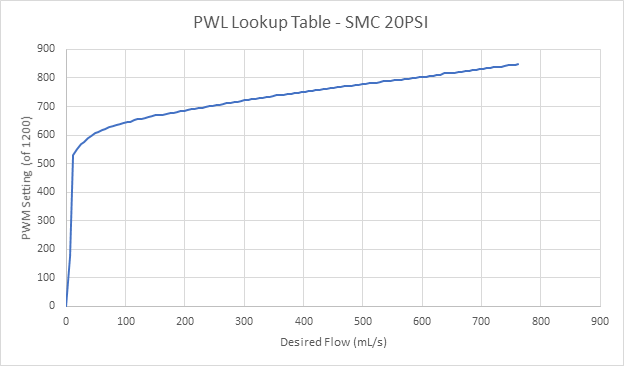
Figure B4: PWL calibration table for SMC valve.
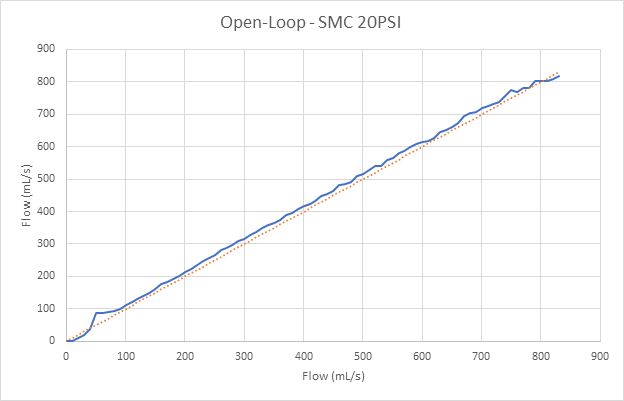
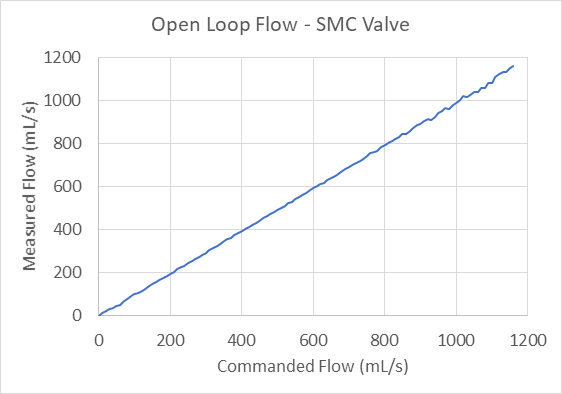
Figure B5: Open-loop accuracy of calibrated SMC valve.
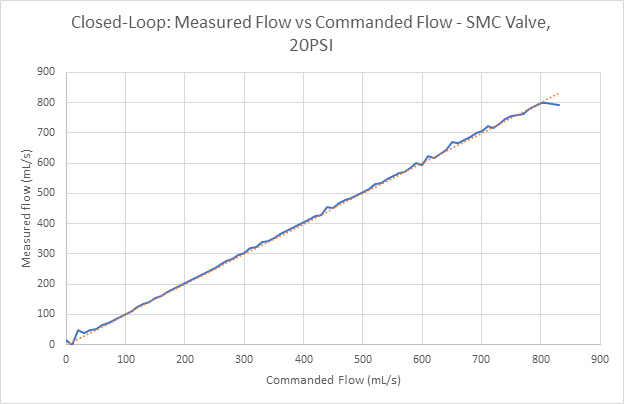
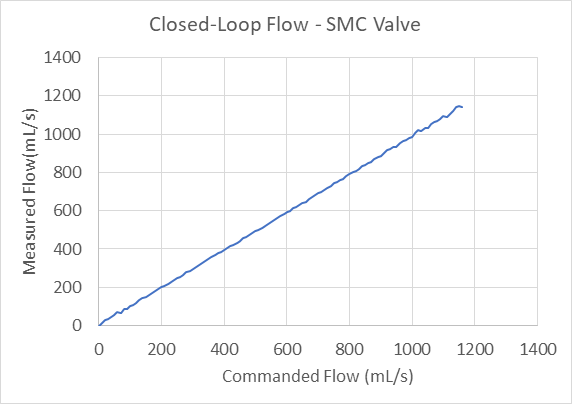
Figure B6: Closed-loop accuracy of calibrated SMC valve.
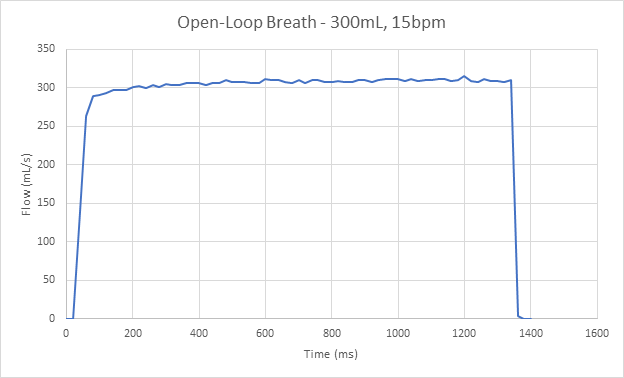
Figure B7: Open-loop transient response.
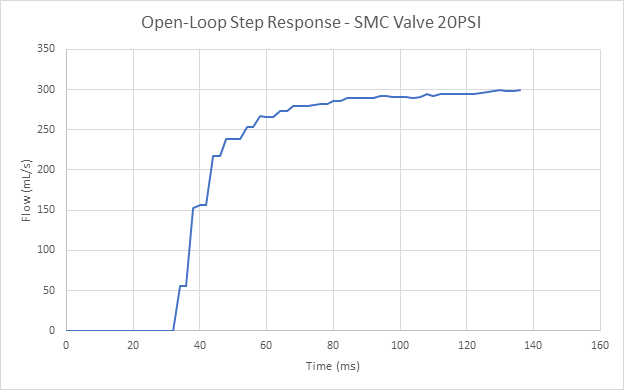
Figure B8: Open-loop transient response closeup of rising edge.
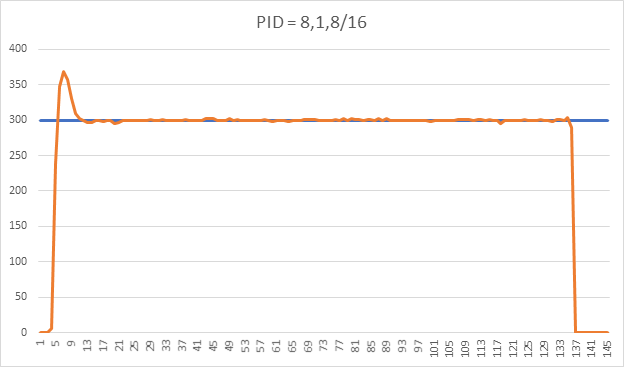
Figure B9: Closed-loop transient response.
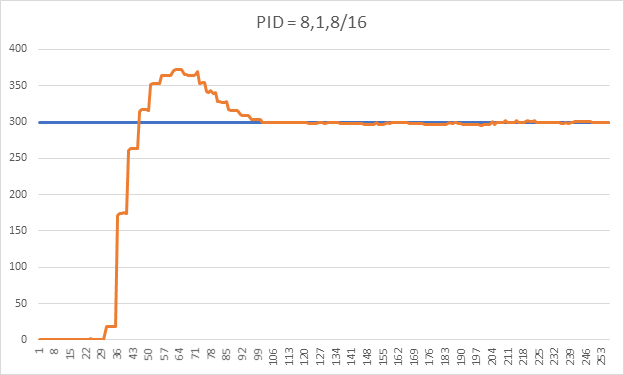
Figure B10: Closed-loop transient response closeup of rising edge.
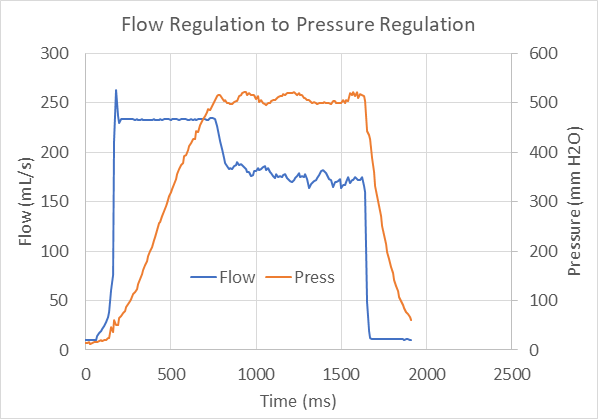
Figure B11: Flow to Pressure Regulation. Flow is regulated to 233mL/s until the pressure limit of 500mm H2O is reached. Then pressure is regulated.
